

Are You Screwed When Your Data is Skewed?
A Statistician's Guide to Embracing Your Data's Favorite Side Lean

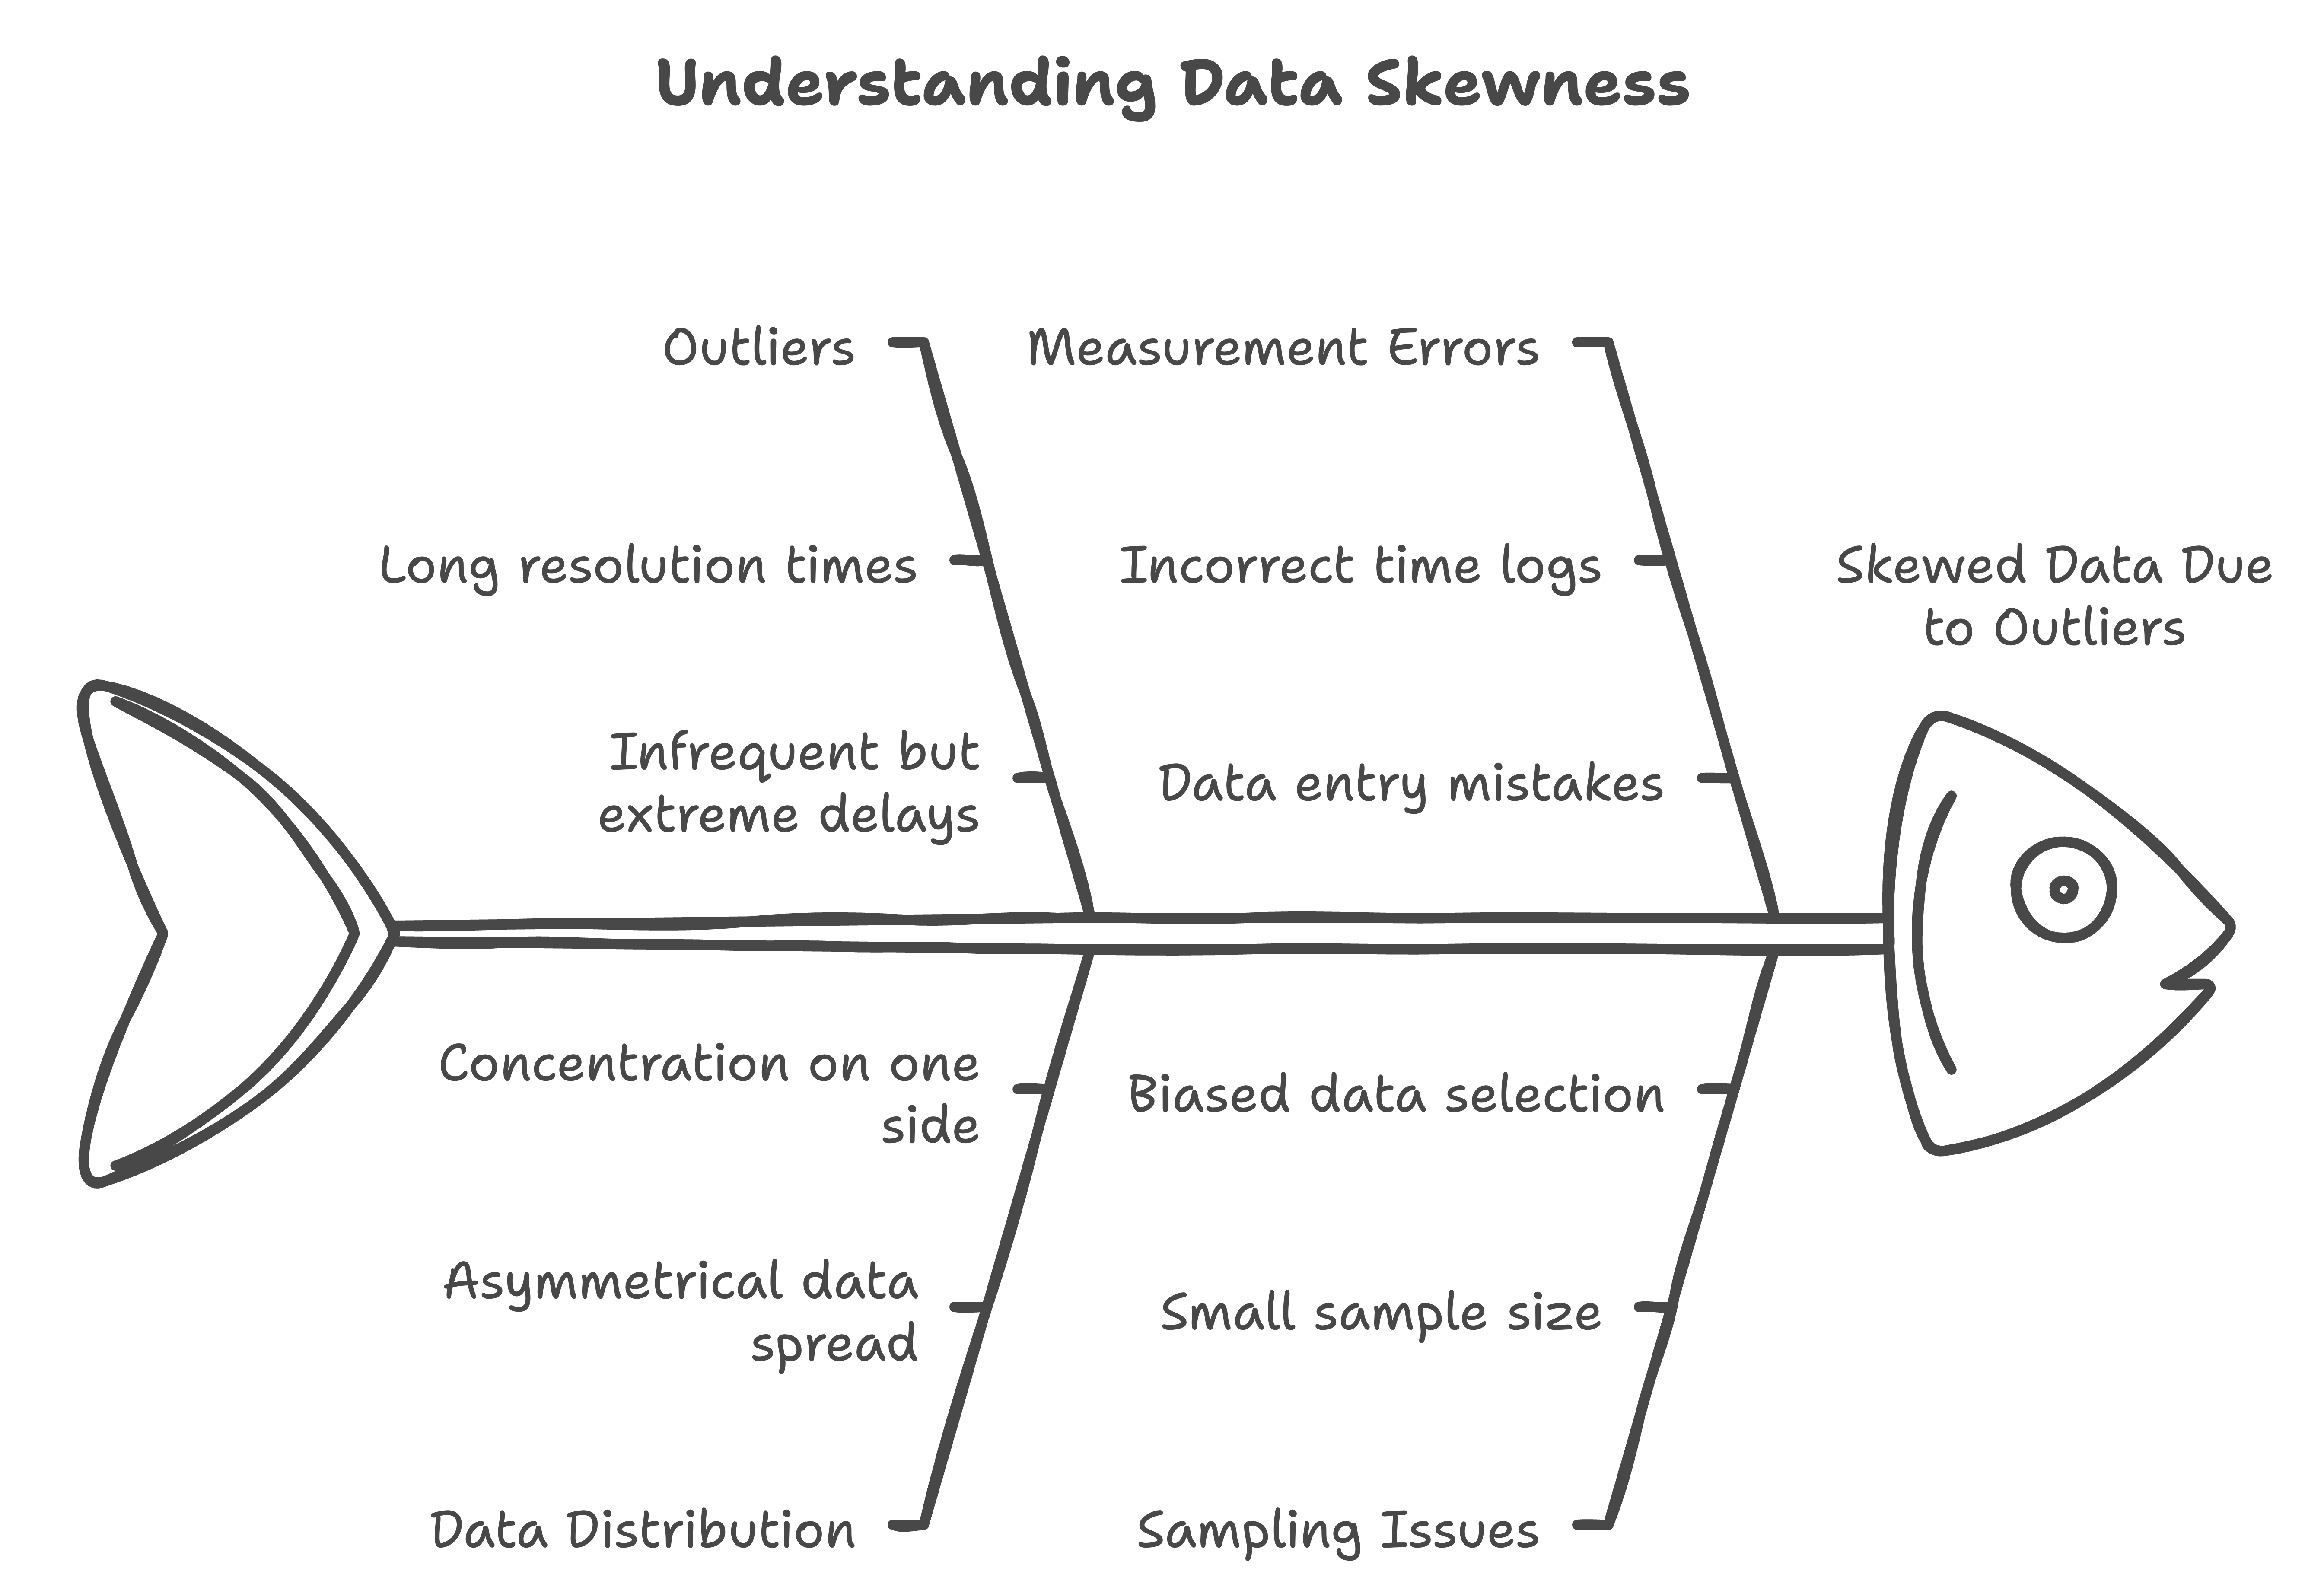
Understanding Skewness
Imagine this: You're looking at your company's customer support response times, and something seems... weird. Most tickets get solved pretty quickly, but there are a few outliers – like that one ticket that took three weeks because Dave from IT was on vacation – and they are making your average response time look really high. Welcome to the world of skewness, where your data is leaning heavily to one side!
What's Skewness, Anyway?
Skewness is when your data leans to one side. It's kind of like how some people lean to one side when they stand. Data can do that too, and it can affect the way we understand what the numbers are telling us. Here are the different types of skewness your data might have:
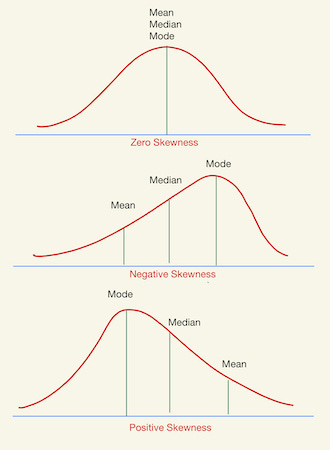
Right Skewed (Positive): Your data has a long tail stretching to the right, like when a kid writes their last letter really long. Think about salaries in a company – most people earn normal amounts, but a few people, like executives, earn really high amounts, which stretches the data to the right. These high values pull the average up, making it seem like everyone is earning more than they actually are.
Left Skewed (Negative): The tail stretches to the left, like a backwards baseball cap. Imagine test scores in a really hard class where most students do really well, but a few struggled and got low scores. In this case, the low scores pull the average down, making it seem like the class didn't do as well as they actually did.
No Skew: Your data is balanced and looks like a bell shape. This is called a "normal distribution" and is what statisticians love to see. It means most of the data points are centered around the average, with fewer and fewer values as you move away from the center.
Why Should You Care?
Skewness can mess up your analysis, just like how a cat can knock over your drink! If you ignore skewness, you could end up making decisions based on the wrong information. Here's what happens when you ignore skewness:
Your average gets pulled: The mean (or average) gets dragged in the direction of the skew. This means it may not accurately represent what's actually going on in your data. For example, if you have one person who earns a super high salary, the average salary will be much higher than what most people earn.
Standard statistical tests might fail: Many standard tests assume your data is normally distributed (no skew). If your data is heavily skewed, these tests might not give you accurate results. You could end up making decisions based on incorrect analysis.
Visualizations can be misleading: Charts and graphs of skewed data can look strange and not tell the real story. Your bar graphs, line graphs, or histograms might be stretched in one direction, making it hard to understand the real patterns in the data.
The Good News: You Can Fix It!
Skewed data doesn't mean you're doomed! You just need to know how to handle it like a pro. Here are a few ways to deal with skewed data and still get good insights:
1. Use the Median
When your data is skewed, use the median instead of the mean. The median is like the reliable friend who doesn't get affected by those crazy outliers. It gives you the middle value, which means half of your data points are above it, and half are below it. This is much better when you have outliers, because it doesn’t get pulled by the really high or low values.
For example, if you are looking at income data, and there are a few people who earn millions, the median will give you a much better idea of what most people earn compared to the average.
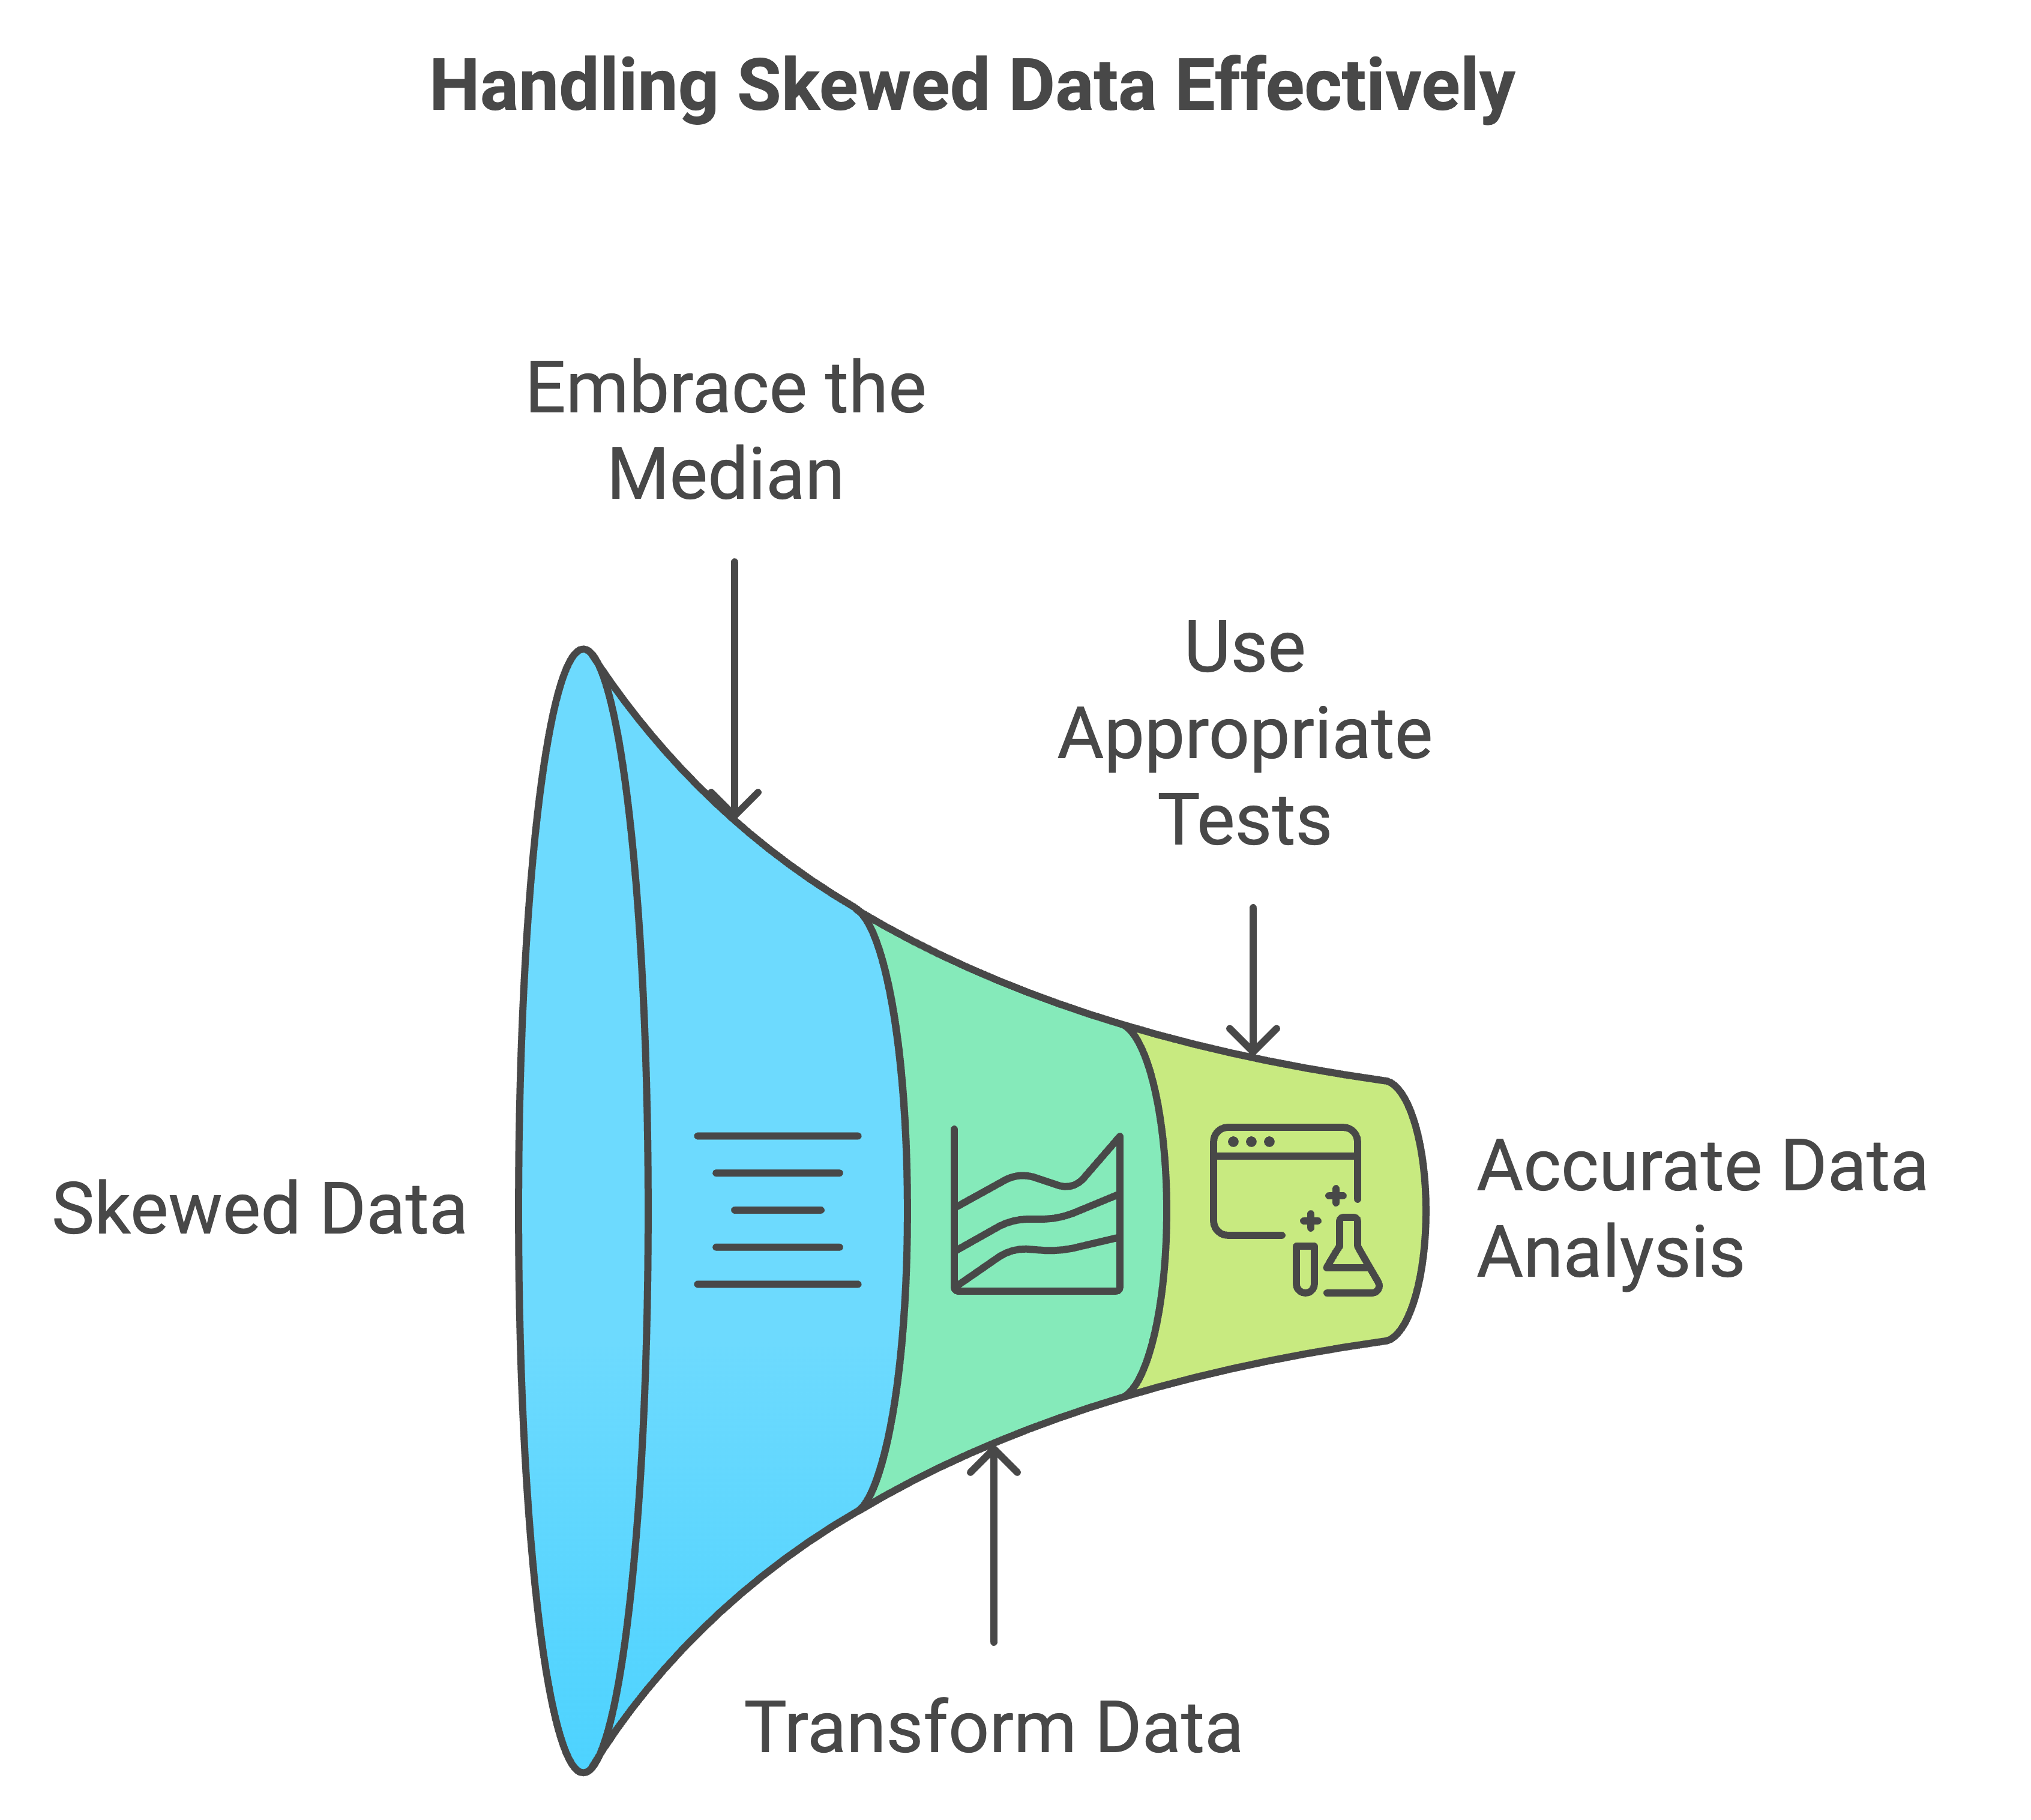
2. Transform Your Data
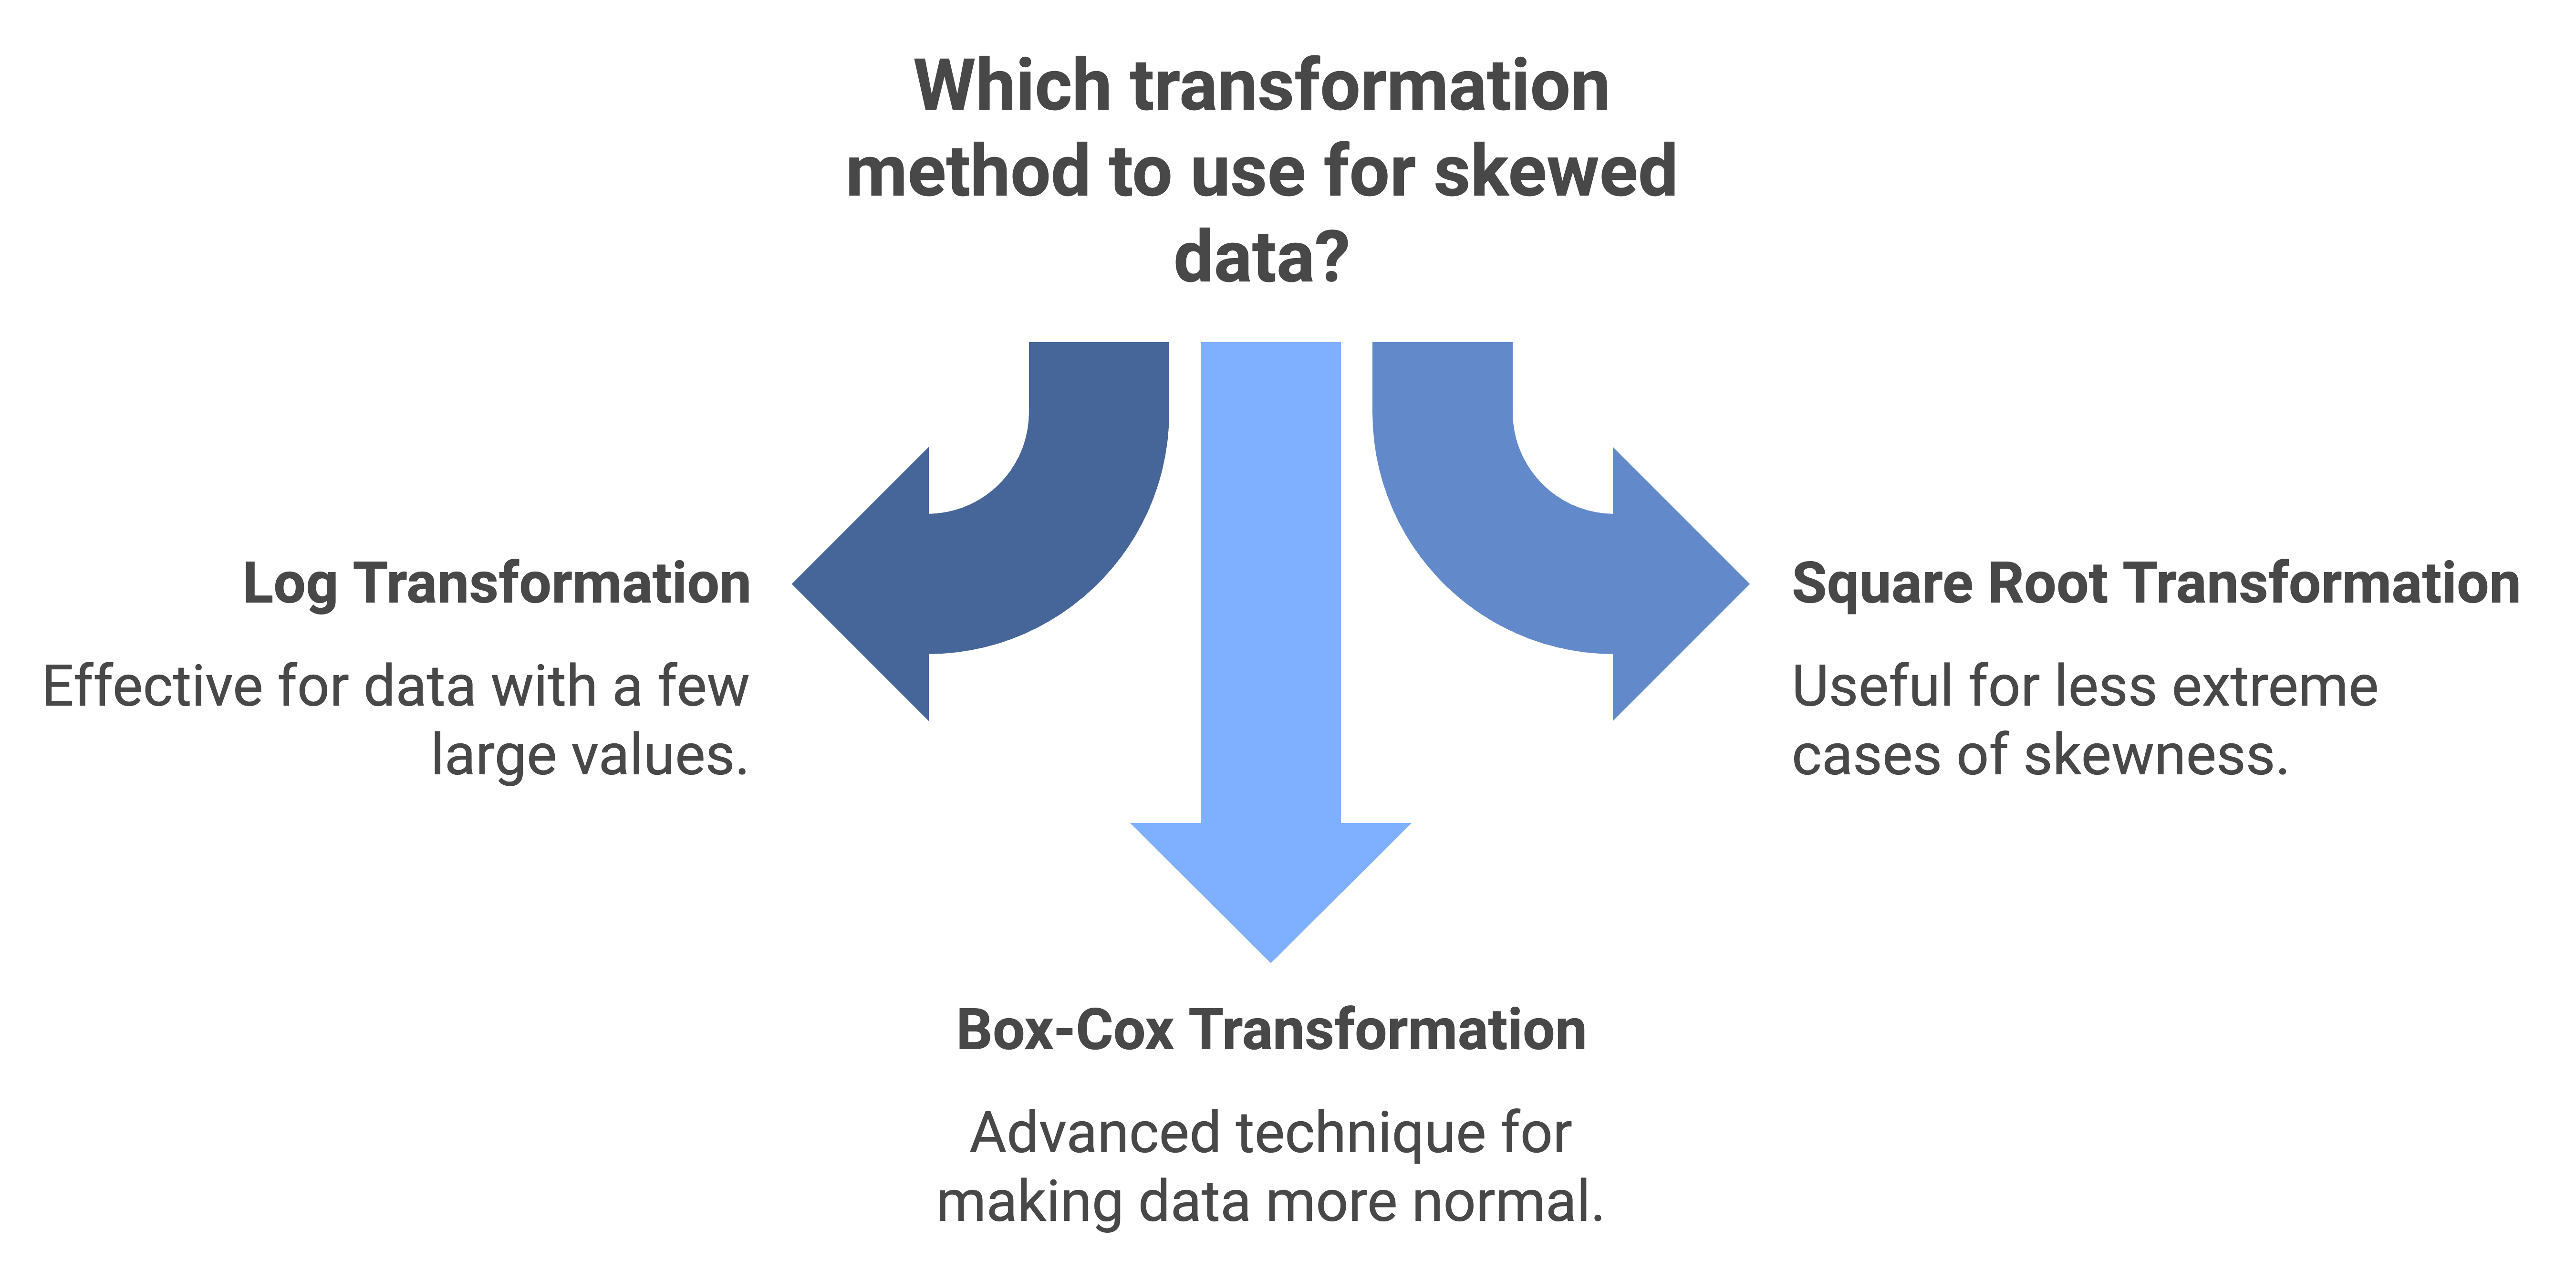
If your data is skewed, you can try changing it a bit to make it less skewed. There are several ways to do this:
Log transformation: This is a popular way to deal with skewed data. It works well if your data has a few really large values that are dragging everything to one side.
Square root transformation: This is useful for less extreme cases of skewness. It helps bring your data closer to normal by reducing the impact of the larger values.
Box-Cox transformation: This one sounds fancy, and it kind of is. It’s a more advanced technique that can help make your data more normal, but it’s not as straightforward as log or square root transformations.
Transforming your data can help make the patterns clearer and your statistical tests more accurate. Just remember that after you transform your data, the numbers won't be in their original form anymore, so interpreting them can be a bit different.
3. Use the Right Tests
Not all statistical tests work well with skewed data, but some are more flexible. These are like that friend who can hang out with any crowd and still have a good time. Here are a few options:
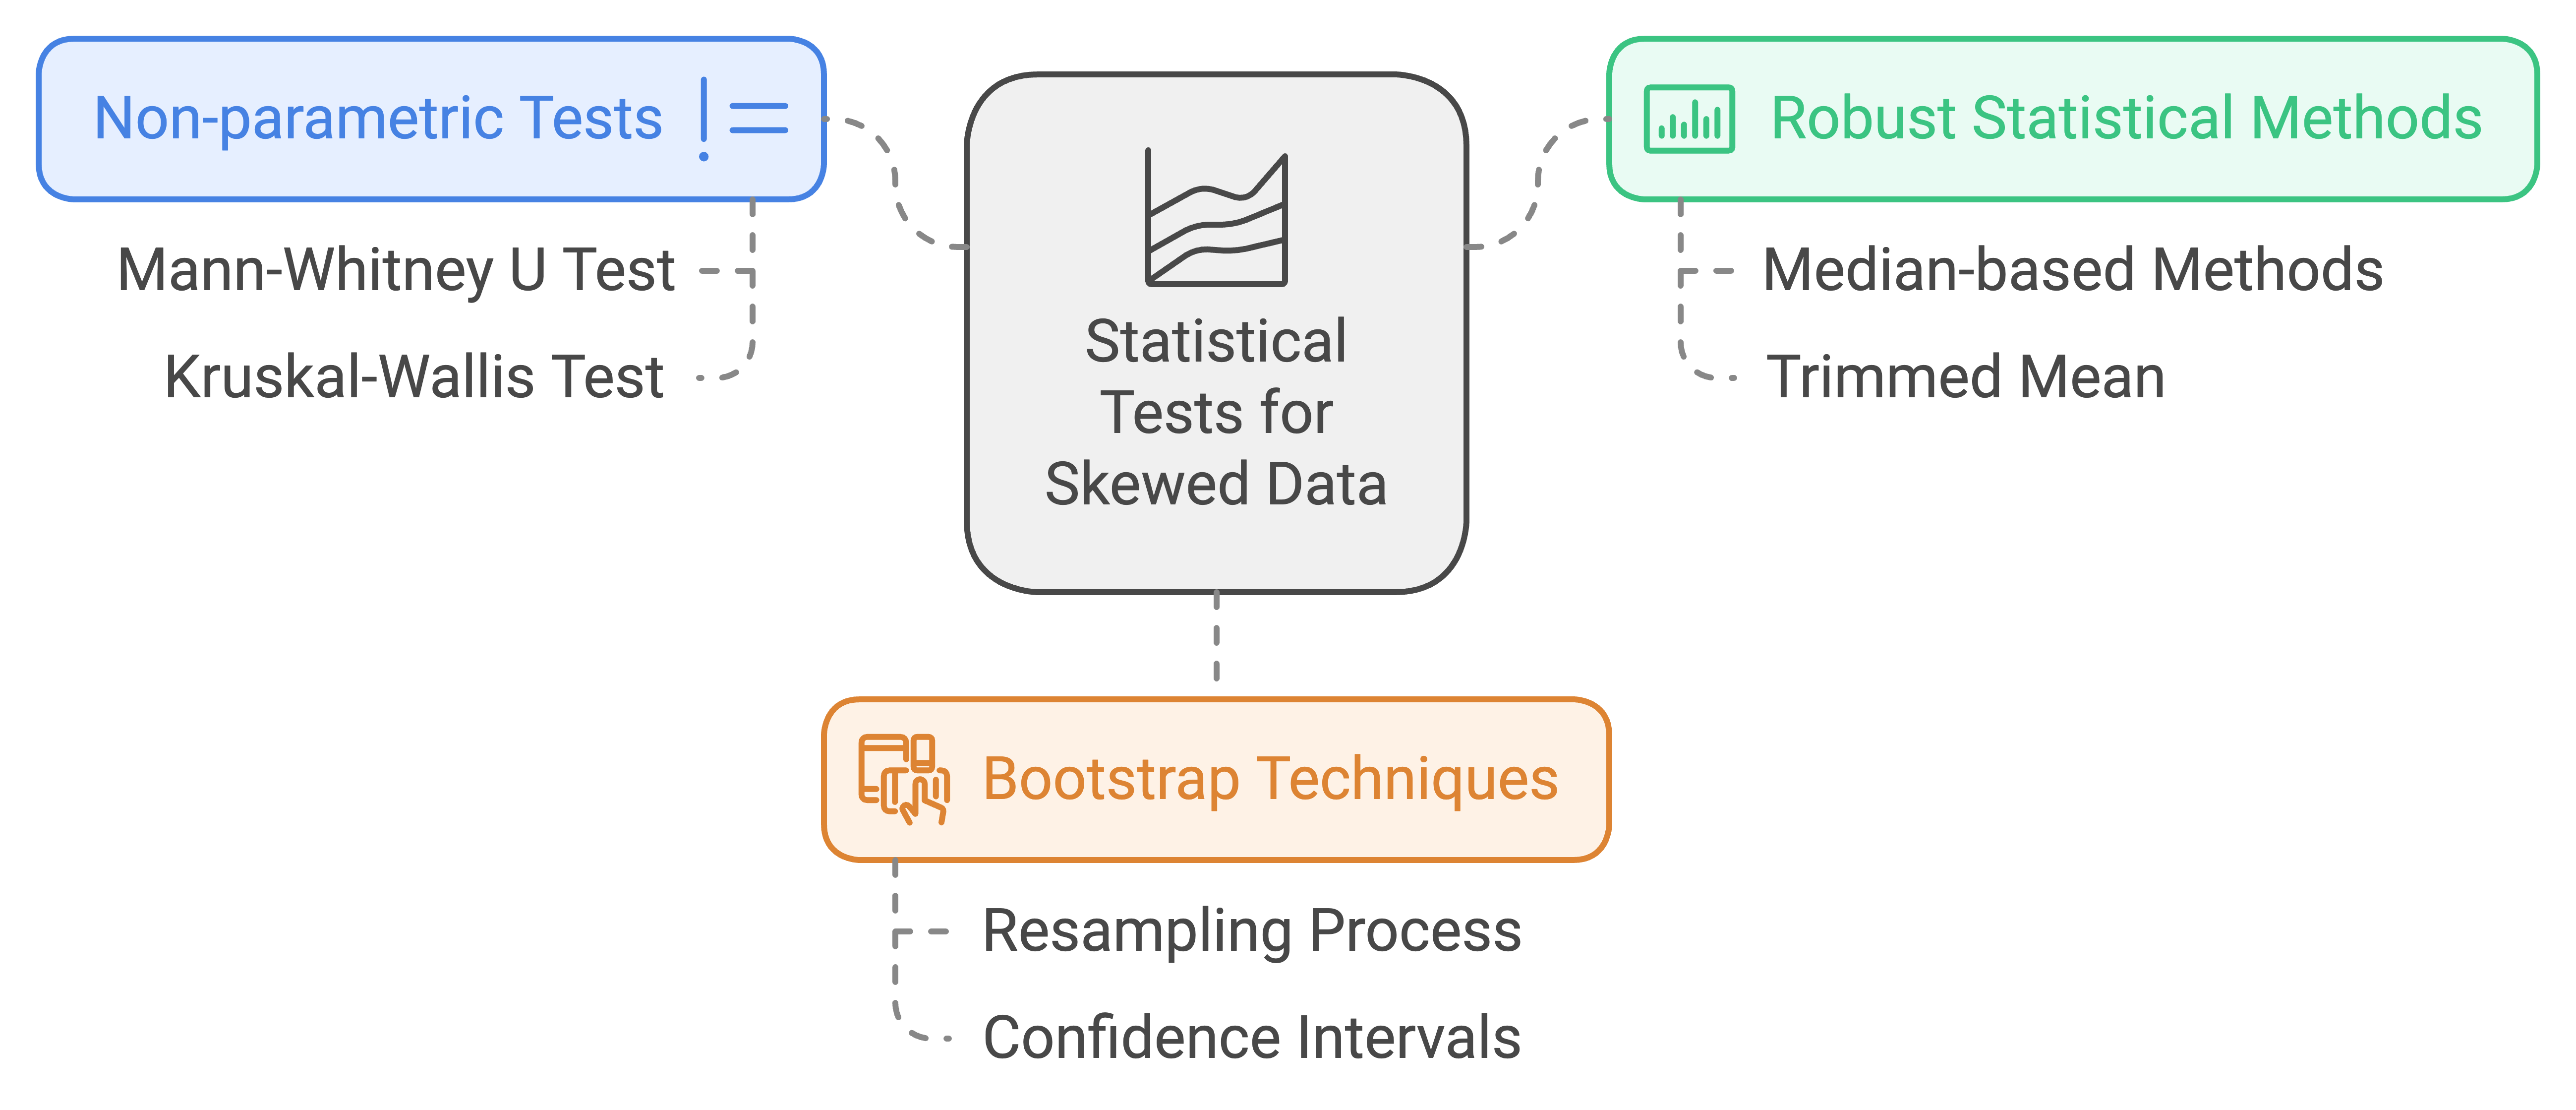
Non-parametric tests: These tests don’t assume your data follows a normal distribution, so they work well with skewed data. They are great when you can't or don't want to transform your data.
Robust statistical methods: These methods are designed to handle outliers and skewness better than traditional techniques. They can give you a more accurate picture of what’s really going on.
Bootstrap techniques: This involves resampling your data to create new samples, which helps make sure your analysis is reliable, even if your data is skewed. It’s a powerful way to get accurate results without having to worry too much about the distribution.
4. Visualize Wisely
When dealing with skewed data, make sure your visualizations are telling the right story. Instead of using bar charts or histograms that might look strange, try using box plots. Box plots show the median and spread of your data and make it easy to spot outliers and understand where most of your values lie.
5. Consider Data Segmentation
Sometimes skewness happens because you have different types of data mixed together. For example, if you're looking at salaries, and you have data from both entry-level workers and executives, the data might be skewed because these groups are very different. In this case, it might make sense to segment your data into smaller groups and analyze them separately.
The Bottom Line
Skewed data isn't a disaster – it's more like an interesting twist in your data story. With the right tools, you can manage skewness just fine. Remember: It's not about having perfect data; it's about knowing how to work with what you have and making the best decisions possible.
So next time someone asks if you're in trouble because your data is skewed, you can confidently say: "Nope, I've got this under control!" You know what steps to take and which tools to use to make sure you understand what's really going on.
P.S. If your data is really skewed, just remember: Even the Leaning Tower of Pisa is famous. Sometimes, it’s all about perspective and embracing the uniqueness of your data!